You are viewing documentation for Flux version: 2.0
Version 2.0 of the documentation is no longer actively maintained. The site that you are currently viewing is an archived snapshot. For up-to-date documentation, see the latest version.
Monitoring with Prometheus
This guide walks you through configuring monitoring for the Flux control plane.
Flux uses kube-prometheus-stack to provide a monitoring stack made out of:
- Prometheus Operator - manages Prometheus clusters atop Kubernetes
- Prometheus - collects metrics from the Flux controllers and Kubernetes API
- Grafana dashboards - displays the Flux control plane resource usage and reconciliation stats
- kube-state-metrics - generates metrics about the state of the Kubernetes objects
Install the Prometheus stack
To install the monitoring stack with flux, first register the Git repository on your cluster:
flux create source git flux-monitoring \
  --interval=30m \
  --url=https://github.com/fluxcd/flux2 \
  --branch=main
Then apply the manifests/monitoring/kube-prometheus-stack kustomization:
flux create kustomization kube-prometheus-stack \
  --interval=1h \
  --prune \
  --source=flux-monitoring \
  --path="./manifests/monitoring/kube-prometheus-stack" \
  --health-check-timeout=5m \
  --wait
The above Kustomization will install the kube-prometheus-stack Helm release in the monitoring namespace.
Prometheus Configuration
Note that the above configuration is not suitable for production. In order to configure long term storage for metrics and highly availability for Prometheus consult the Helm chart documentation.Install the Loki stack (optional)
To install Grafana Loki and Promtail in the monitoring namespace, apply the
manifests/monitoring/loki-stack
kustomization:
flux create kustomization loki-stack \
  --depends-on=kube-prometheus-stack \
  --interval=1h \
  --prune \
  --source=flux-monitoring \
  --path="./manifests/monitoring/loki-stack" \
  --health-check-timeout=5m \
  --wait
Install Flux Grafana dashboards
Note that the Flux controllers expose the /metrics endpoint on port 8080.
When using Prometheus Operator you need a PodMonitor object to configure scraping for the controllers.
Apply the
manifests/monitoring/monitoring-config
containing the PodMonitor and the ConfigMap with Flux’s Grafana dashboards:
flux create kustomization monitoring-config \
  --depends-on=kube-prometheus-stack \
  --interval=1h \
  --prune=true \
  --source=flux-monitoring \
  --path="./manifests/monitoring/monitoring-config" \
  --health-check-timeout=1m \
  --wait
You can access Grafana using port forwarding:
kubectl -n monitoring port-forward svc/kube-prometheus-stack-grafana 3000:80
To log in to the Grafana dashboard, you can use the default credentials from the kube-prometheus-stack chart:
username: admin
password: prom-operator
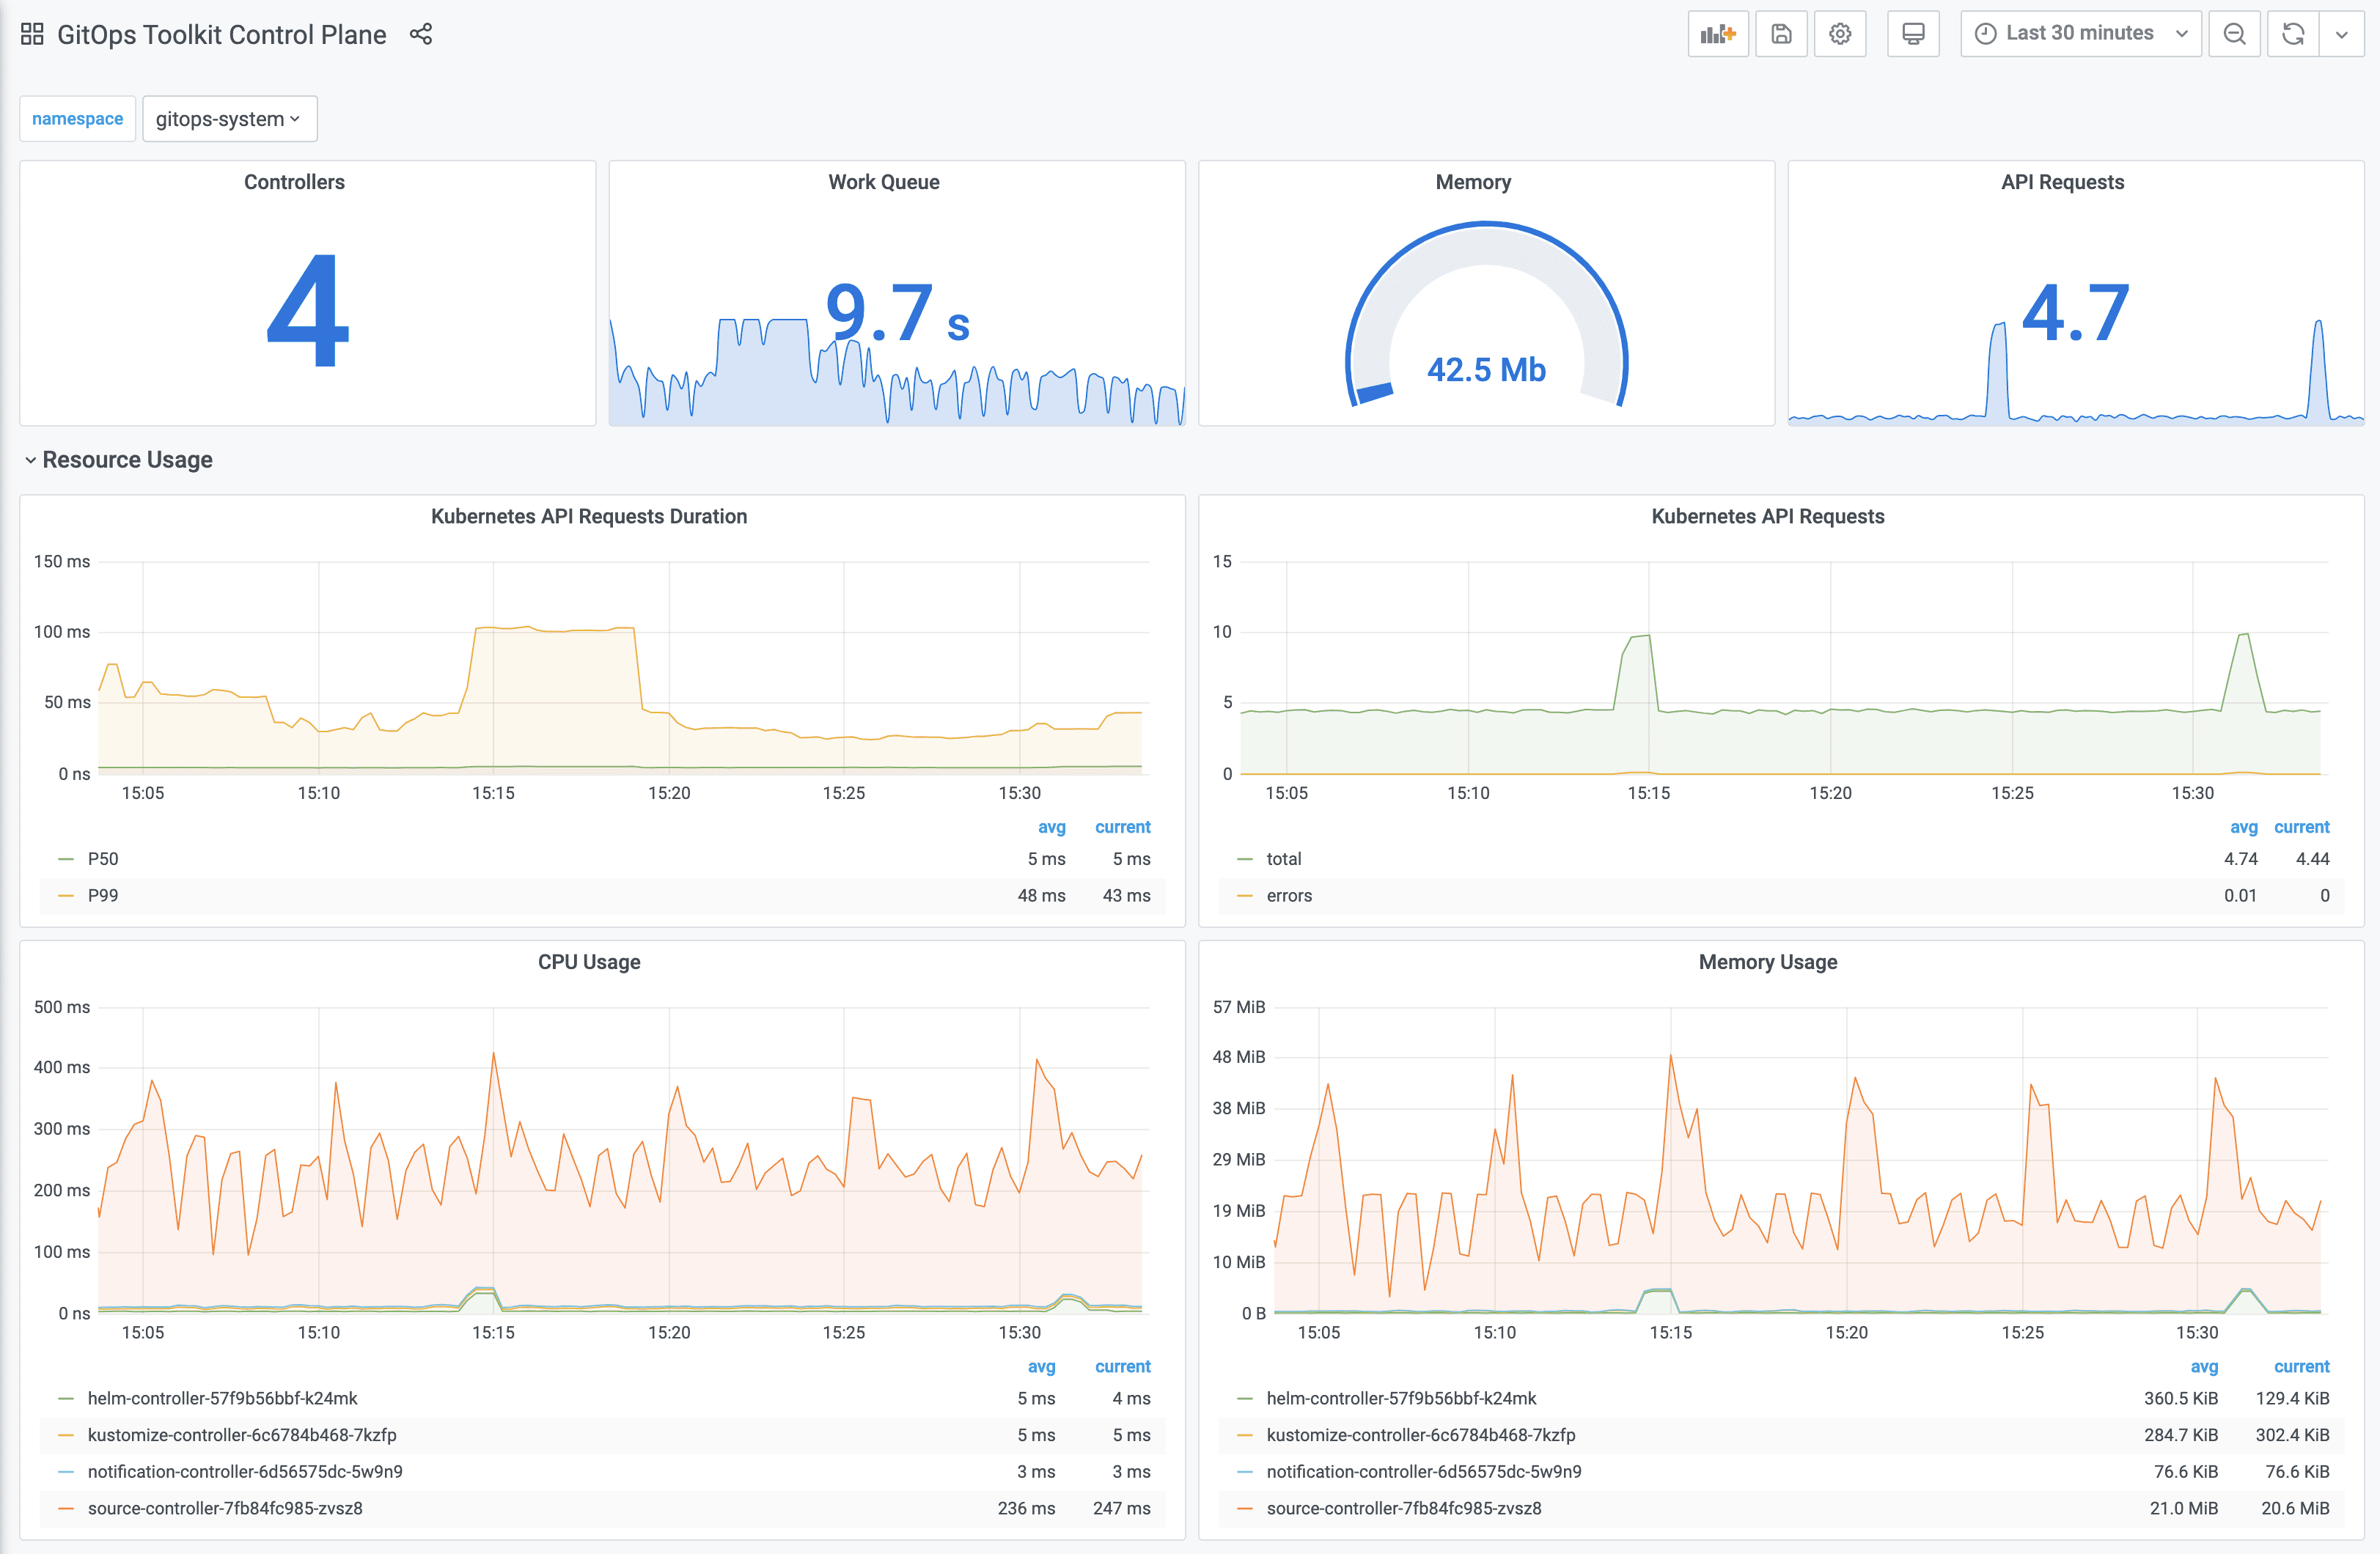
Flux dashboards
Control plane dashboard http://localhost:3000/d/flux-control-plane:
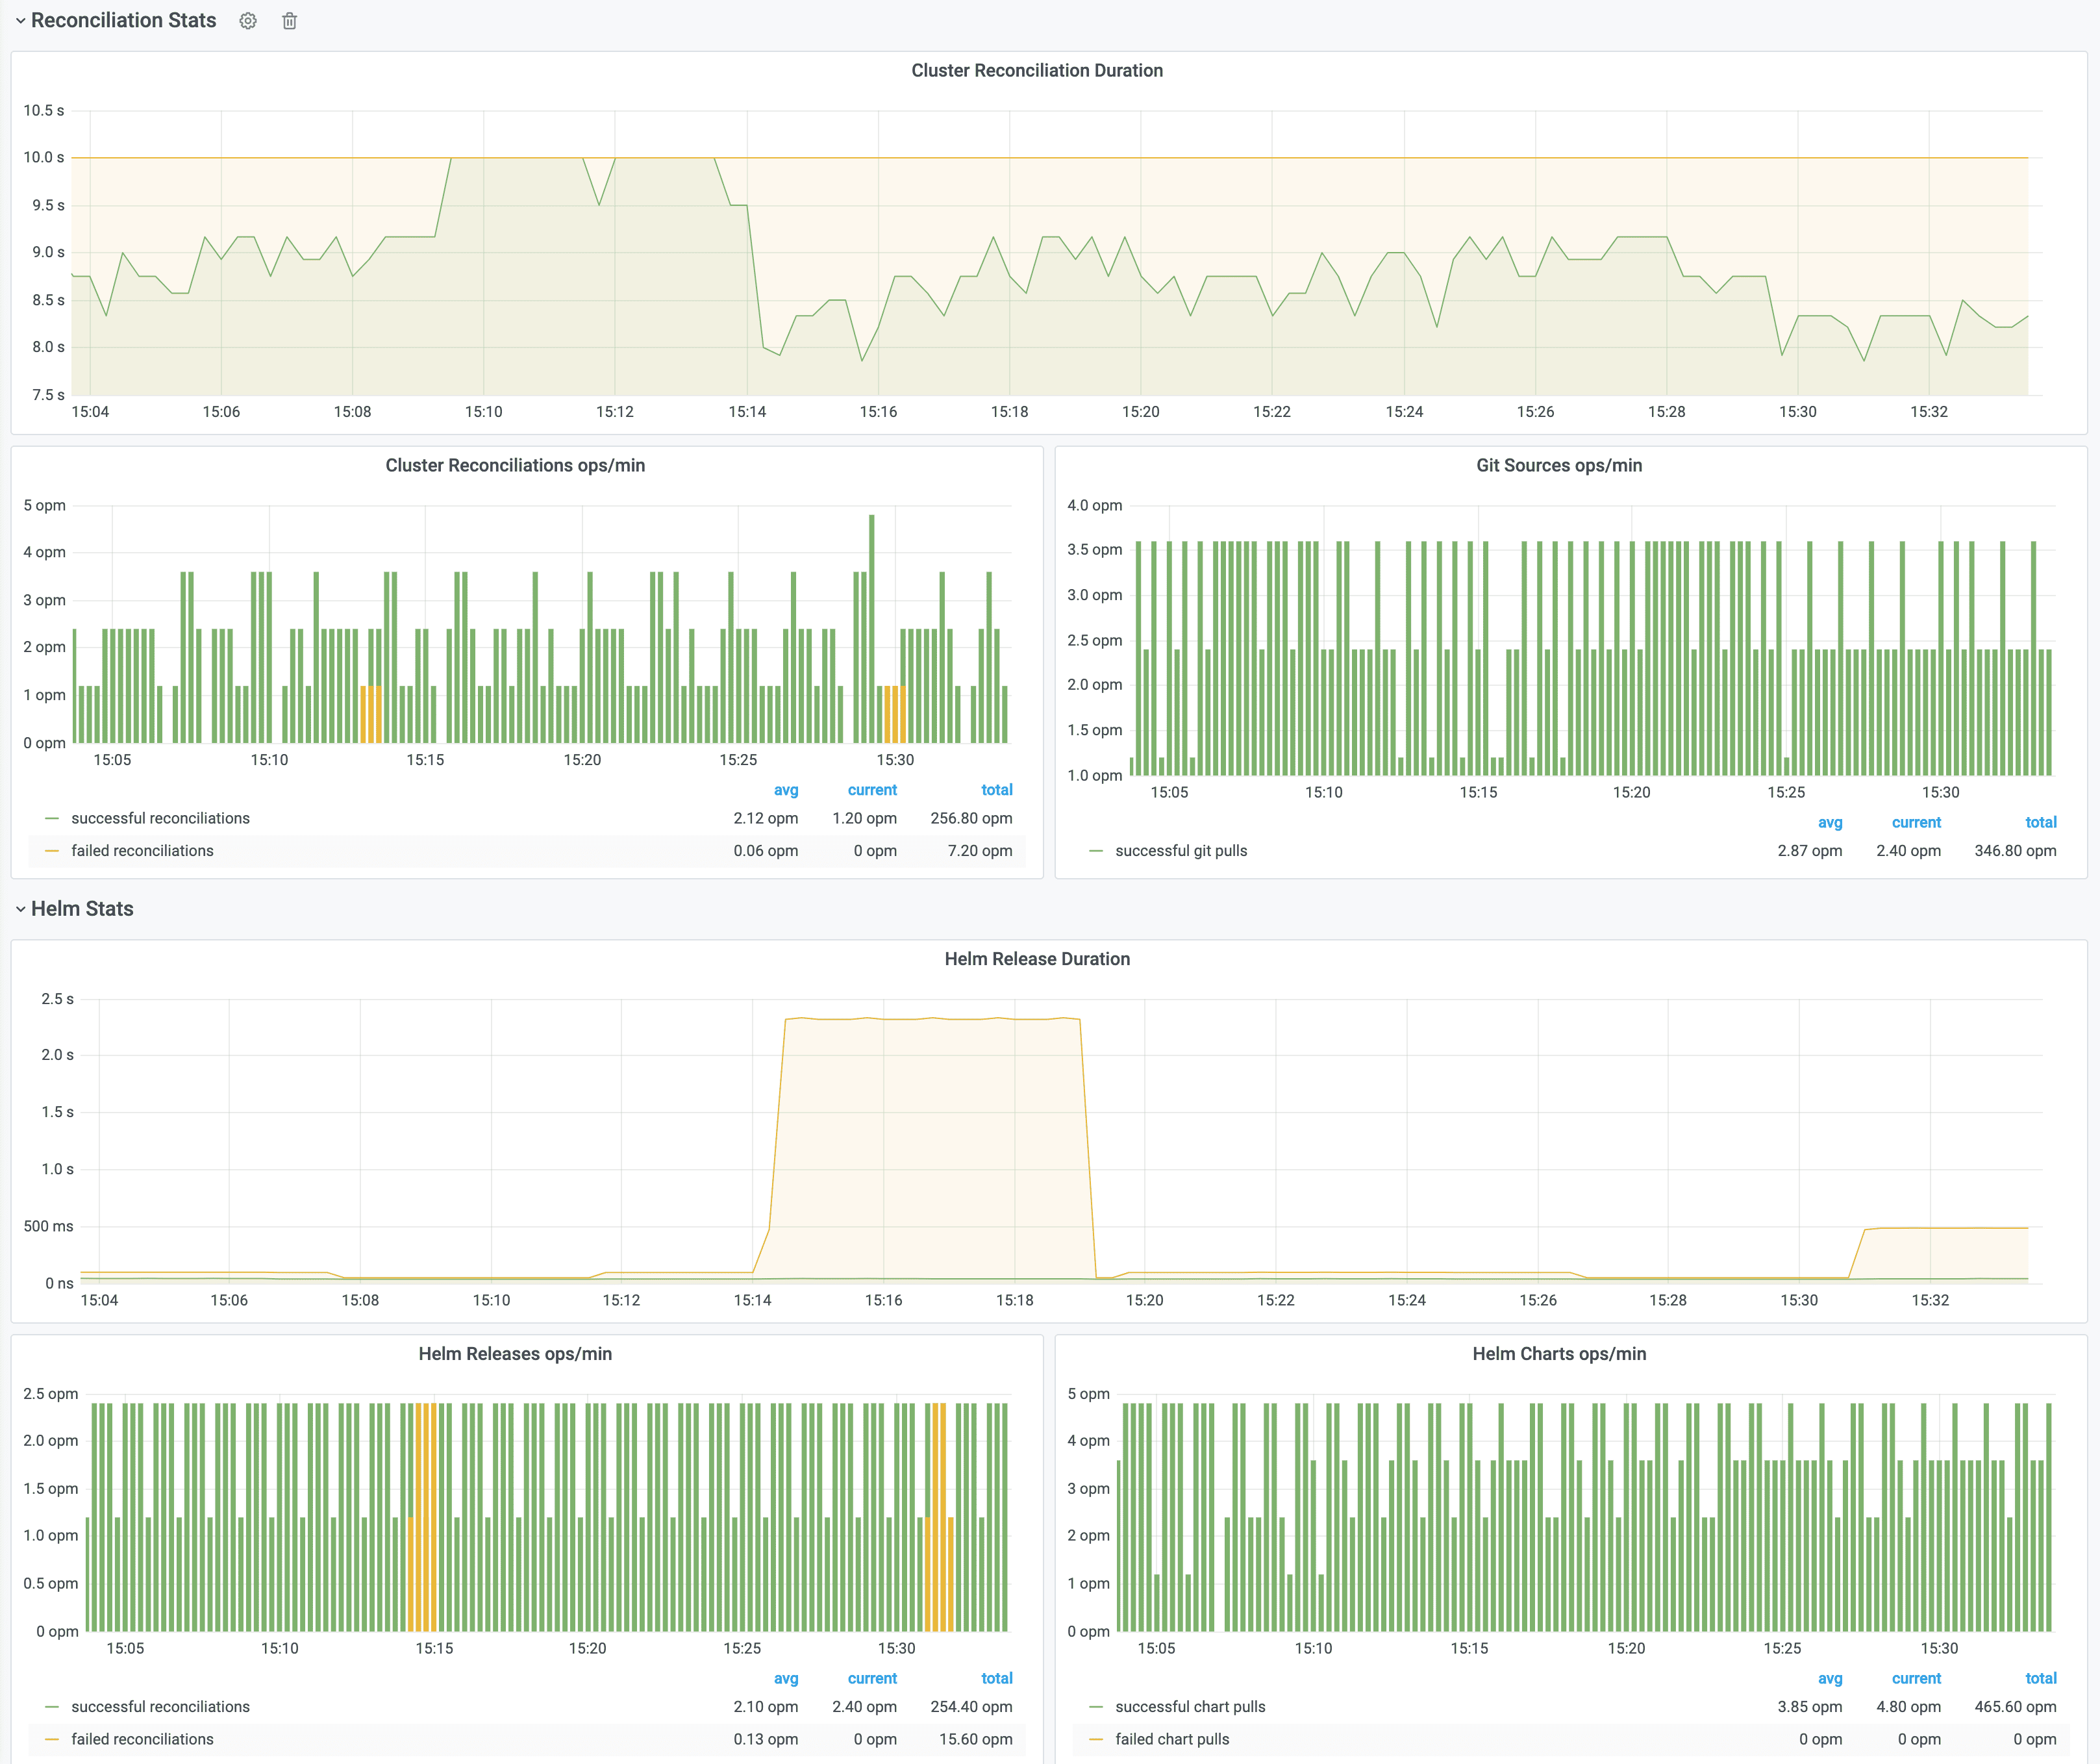
Cluster reconciliation dashboard http://localhost:3000/d/flux-cluster:
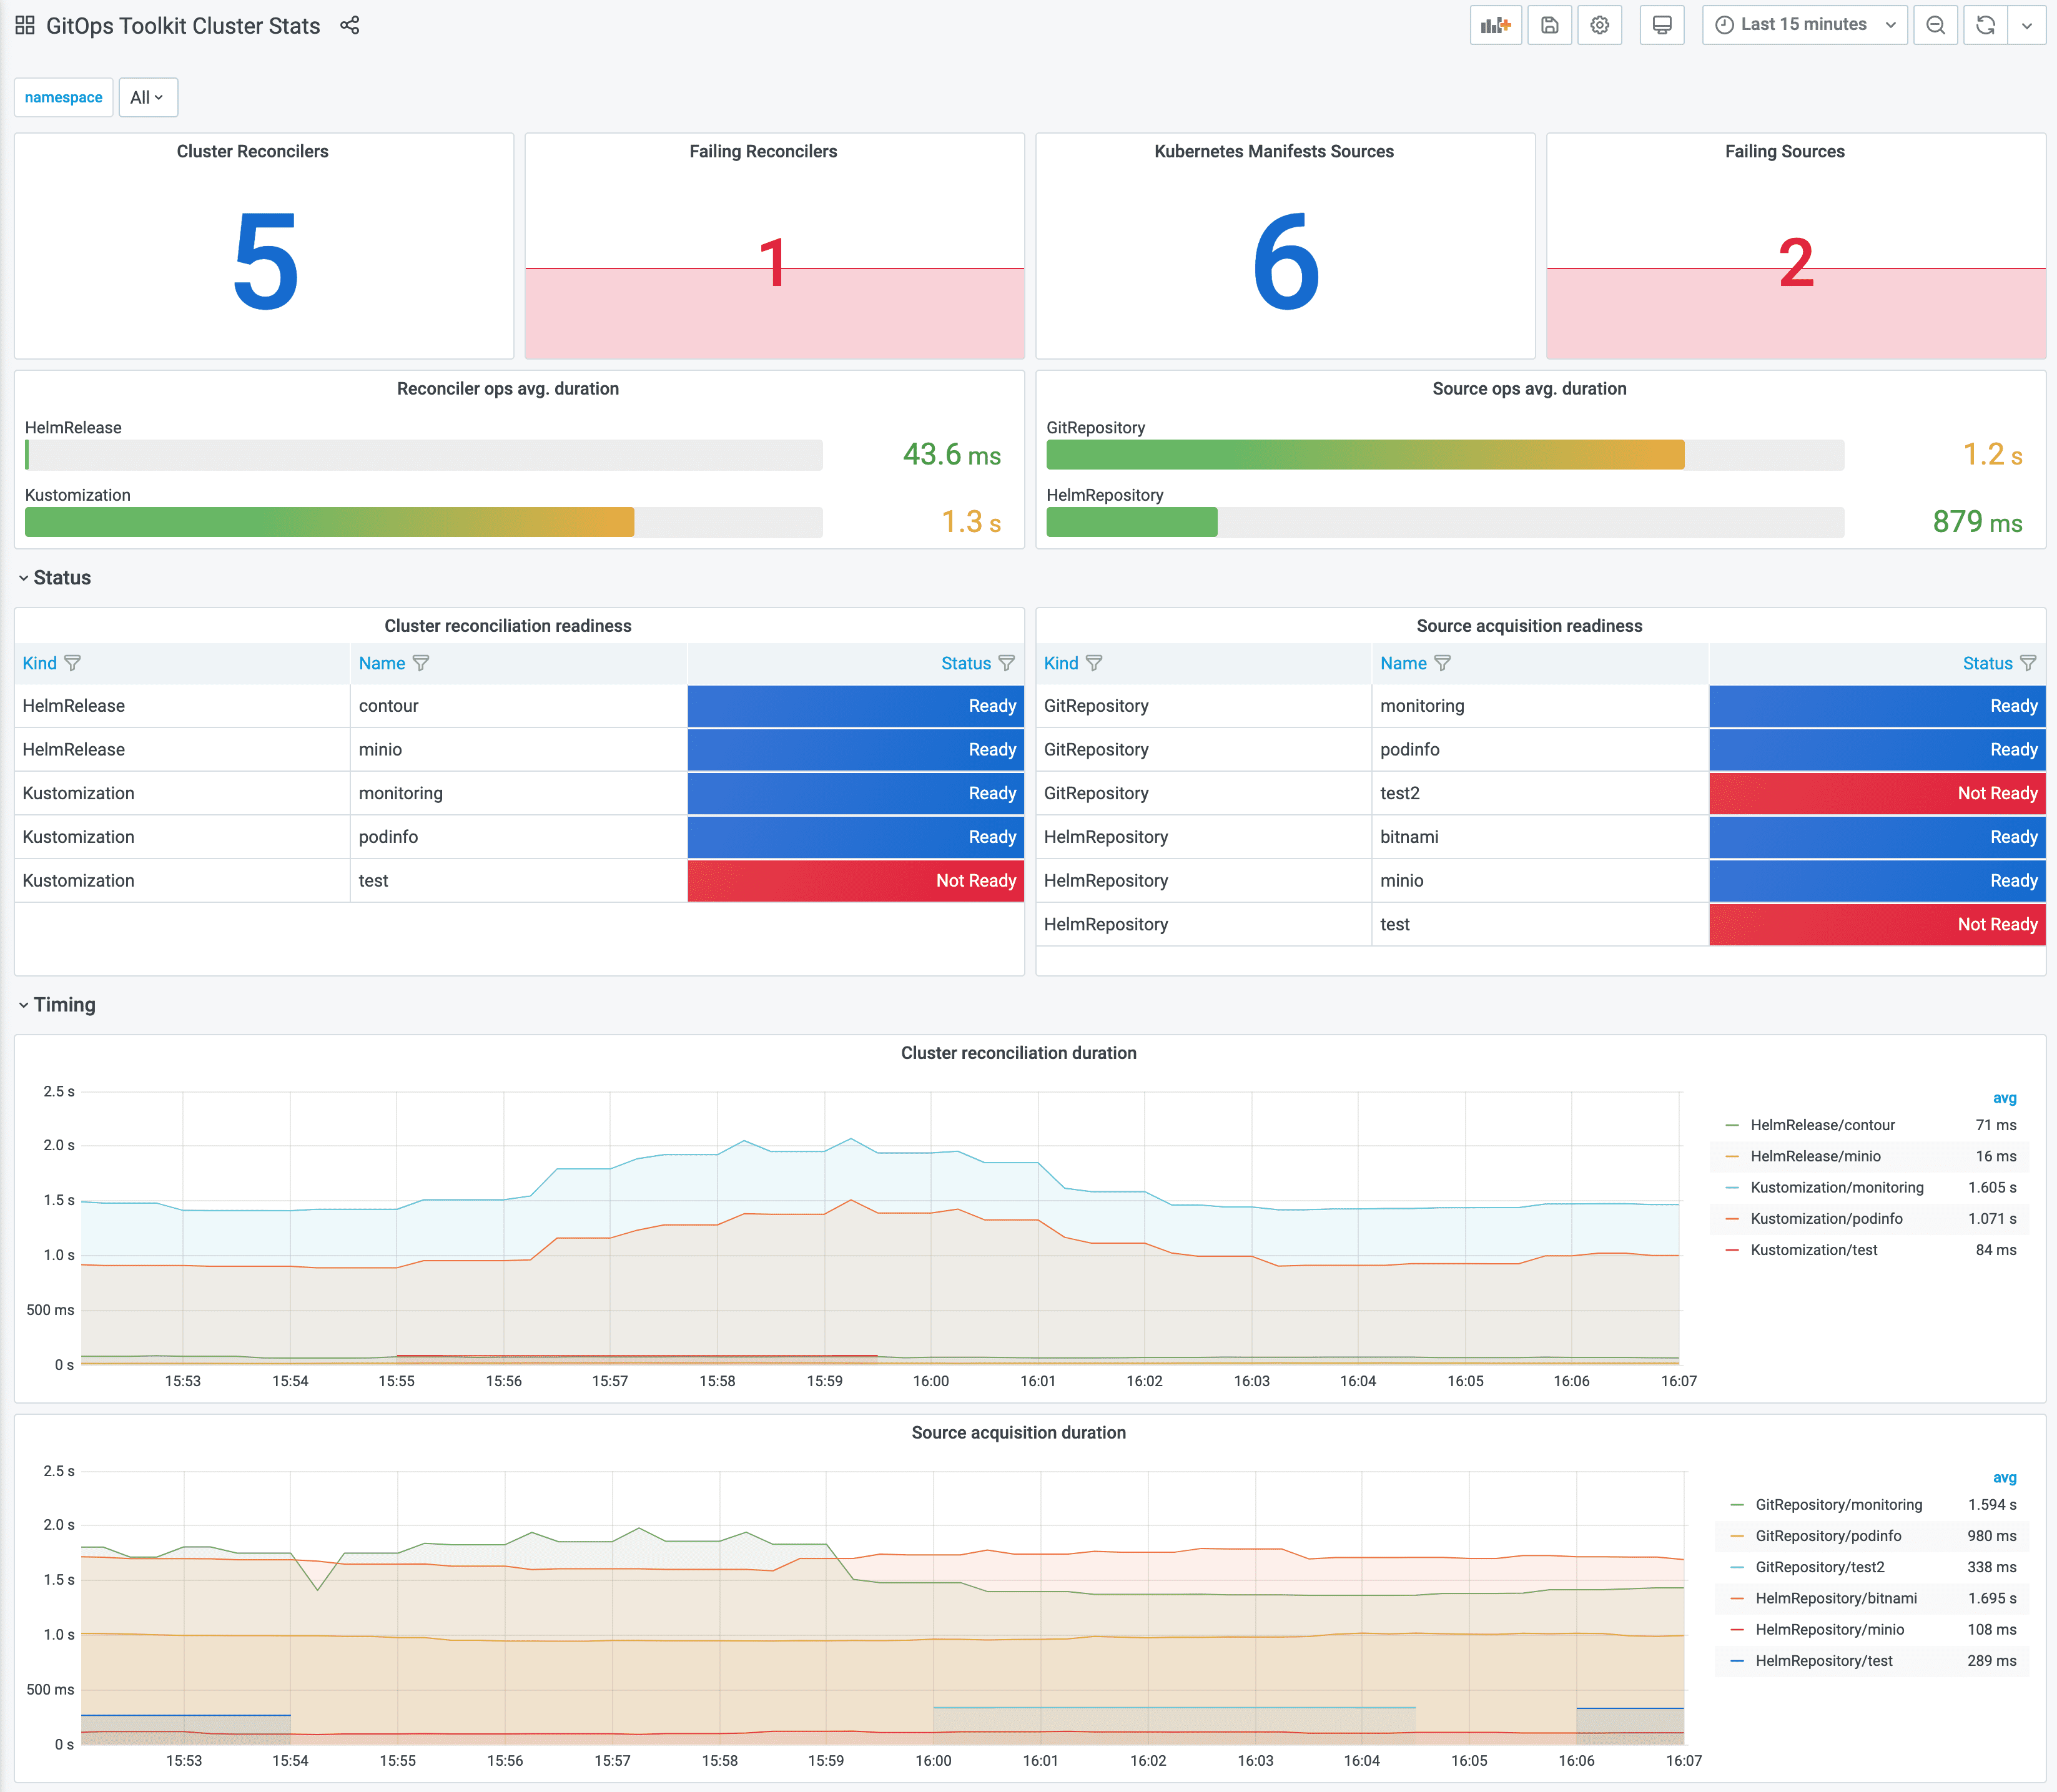
Control plane logs http://localhost:3000/d/flux-logs:
If you wish to use your own Prometheus and Grafana instances, then you can import the dashboards from GitHub.
Grafana annotations
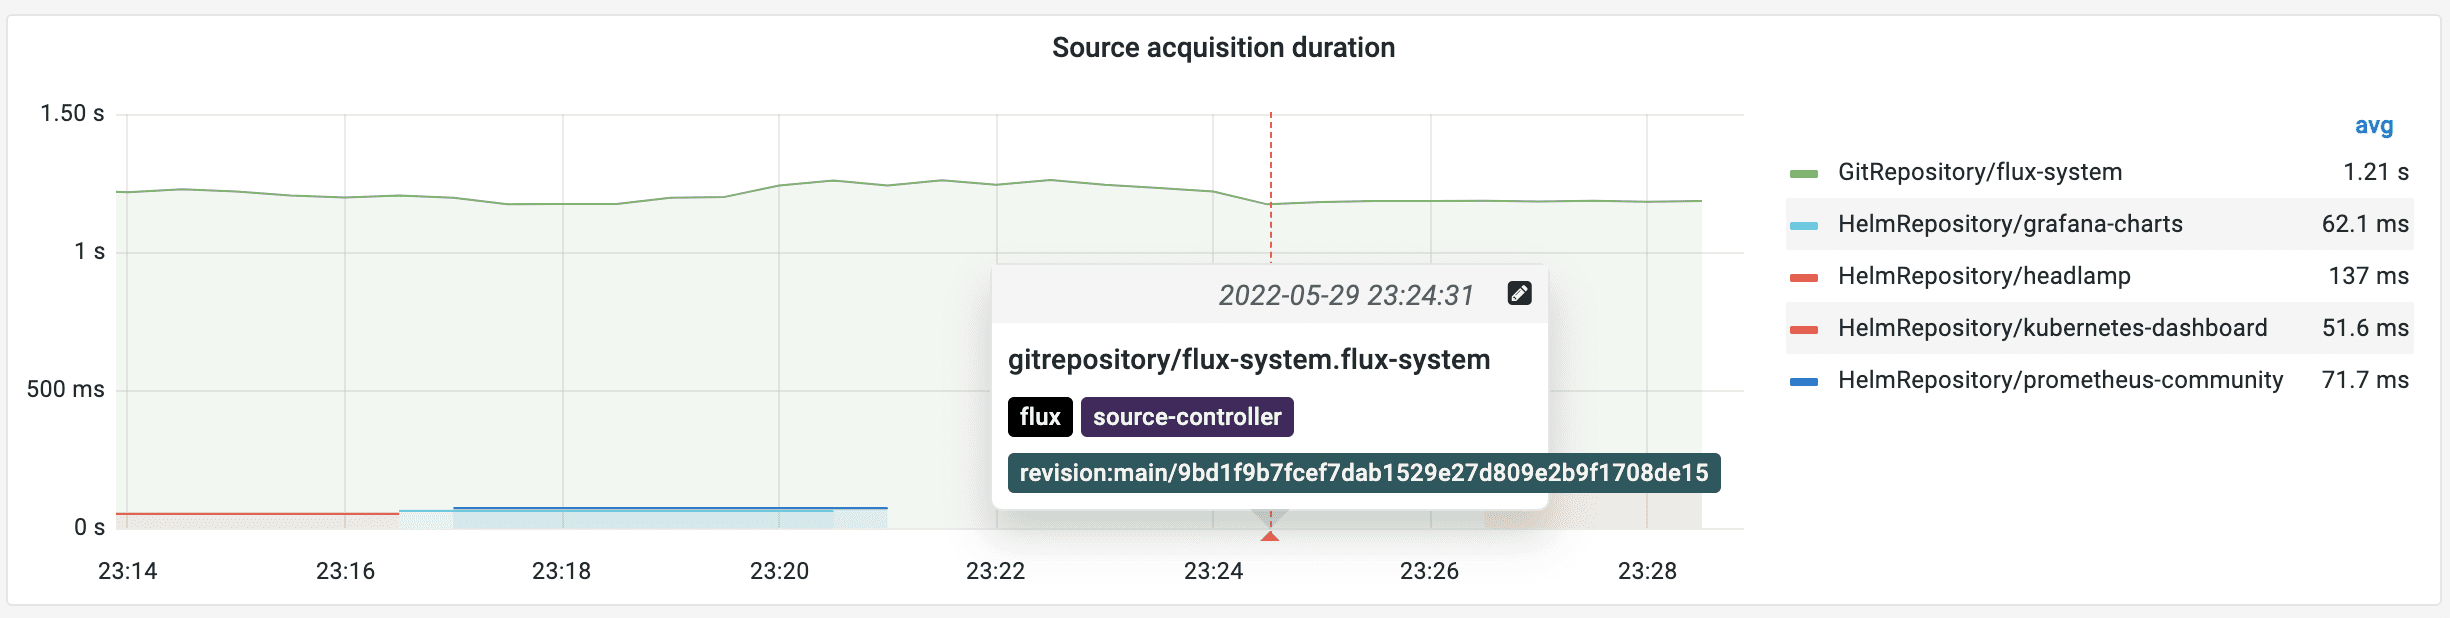
To display the Flux notifications on Grafana dashboards you can configure Flux to push events to Grafana annotations API:
apiVersion: notification.toolkit.fluxcd.io/v1beta2
kind: Alert
metadata:
  name: grafana
  namespace: monitoring
spec:
  providerRef:
    name: grafana
  eventSeverity: info
  eventSources:
    - kind: GitRepository
      name: '*'
      namespace: flux-system
---
apiVersion: notification.toolkit.fluxcd.io/v1beta2
kind: Provider
metadata:
  name: grafana
  namespace: monitoring
spec:
  type: grafana
  address: "http://kube-prometheus-stack-grafana.monitoring/api/annotations"
  secretRef:
    name: grafana-auth
For more details on how to integrate Flux with Grafana API please see the Grafana provider documentation.
Metrics
For each toolkit.fluxcd.io kind,
the controllers expose a gauge metric to track the Ready condition status,
and a histogram with the reconciliation duration in seconds.
Ready status metrics:
gotk_reconcile_condition{kind, name, namespace, type="Ready", status="True"}
gotk_reconcile_condition{kind, name, namespace, type="Ready", status="False"}
gotk_reconcile_condition{kind, name, namespace, type="Ready", status="Unknown"}
gotk_reconcile_condition{kind, name, namespace, type="Ready", status="Deleted"}
Suspend status metrics:
gotk_suspend_status{kind, name, namespace}
Time spent reconciling:
gotk_reconcile_duration_seconds_bucket{kind, name, namespace, le}
gotk_reconcile_duration_seconds_sum{kind, name, namespace}
gotk_reconcile_duration_seconds_count{kind, name, namespace}
Alert manager example:
groups:
  - name: Flux
    rules:
      - alert: ReconciliationFailure
        expr: max(gotk_reconcile_condition{status="False",type="Ready"}) by (exported_namespace, name, kind) + on(exported_namespace, name, kind) (max(gotk_reconcile_condition{status="Deleted"}) by (exported_namespace, name, kind)) * 2 == 1
        for: 10m
        labels:
          severity: page
        annotations:
          summary: '{{ $labels.kind }} {{ $labels.exported_namespace }}/{{ $labels.name }} reconciliation has been failing for more than ten minutes.'
Logs
The Flux controllers follow the Kubernetes structured logging conventions.
The logs are written to stderr in JSON format, with the following common tags:
loggercontroller reconciler nametstimestamp in the ISO 8601 formatlevelcan bedebug,infoorerrormsginfo or error descriptionerrorerror details
Example of a info log:
{
  "level": "info",
  "ts": "2022-06-03T11:42:49.159Z",
  "logger": "controller.kustomization",
  "msg": "server-side apply completed",
  "name": "demo-frontend",
  "namespace": "msdemo",
  "revision": "main@sha1:30081ad7170fb8168536768fe399493dd43160d7",
  "output": {
    "ConfigMap/msdemo/demo-frontend-redis": "created",
    "Deployment/msdemo/demo-frontend-app": "configured",
    "Deployment/msdemo/demo-frontend-redis": "created",
    "HorizontalPodAutoscaler/msdemo/demo-frontend-app": "deleted",
    "Service/msdemo/demo-frontend-app": "unchanged",
    "Service/msdemo/demo-frontend-redis": "created"
  }
}
Example of an error log:
{
  "level": "error",
  "ts": "2022-06-03T12:42:05.849Z",
  "logger": "controller.kustomization",
  "msg": "Reconciliation failed after 1.864823186s, next try in 5m0s",
  "name": "demo-frontend",
  "namespace": "msdemo",
  "revision": "main@sha1:f68c334e0f5fae791d1e47dbcabed256f4f89e68",
  "error": "Service/msdemo/frontend dry-run failed, reason: Invalid, error: Service frontend is invalid: spec.type: Unsupported value: Ingress"
}